House of Commons Library: Hate Crime Statistics
Since April 2015, there have been spikes for racial or religiously aggravated offences not matched by their non-aggravated equivalent at the time of the EU referendum, 2017 terrorist attacks and 2020 Black Lives Matter protests. Though there were similar spikes in the following and preceding summers, the trends were similar for the two types of offences.
The figures for 2021/22 represented a 26% increase on the previous year. The increase in 2021/22 has partly been attributed to a greater number of crimes being recorded by the police in the year ending March 2022 in comparison to the previous year due to extensive restrictions put in place to combat the Covid-19 pandemic.
- https://commonslibrary.parliament.uk/research-briefings/cbp-8537/
- https://researchbriefings.files.parliament.uk/documents/CBP-8537/CBP-8537.pdf
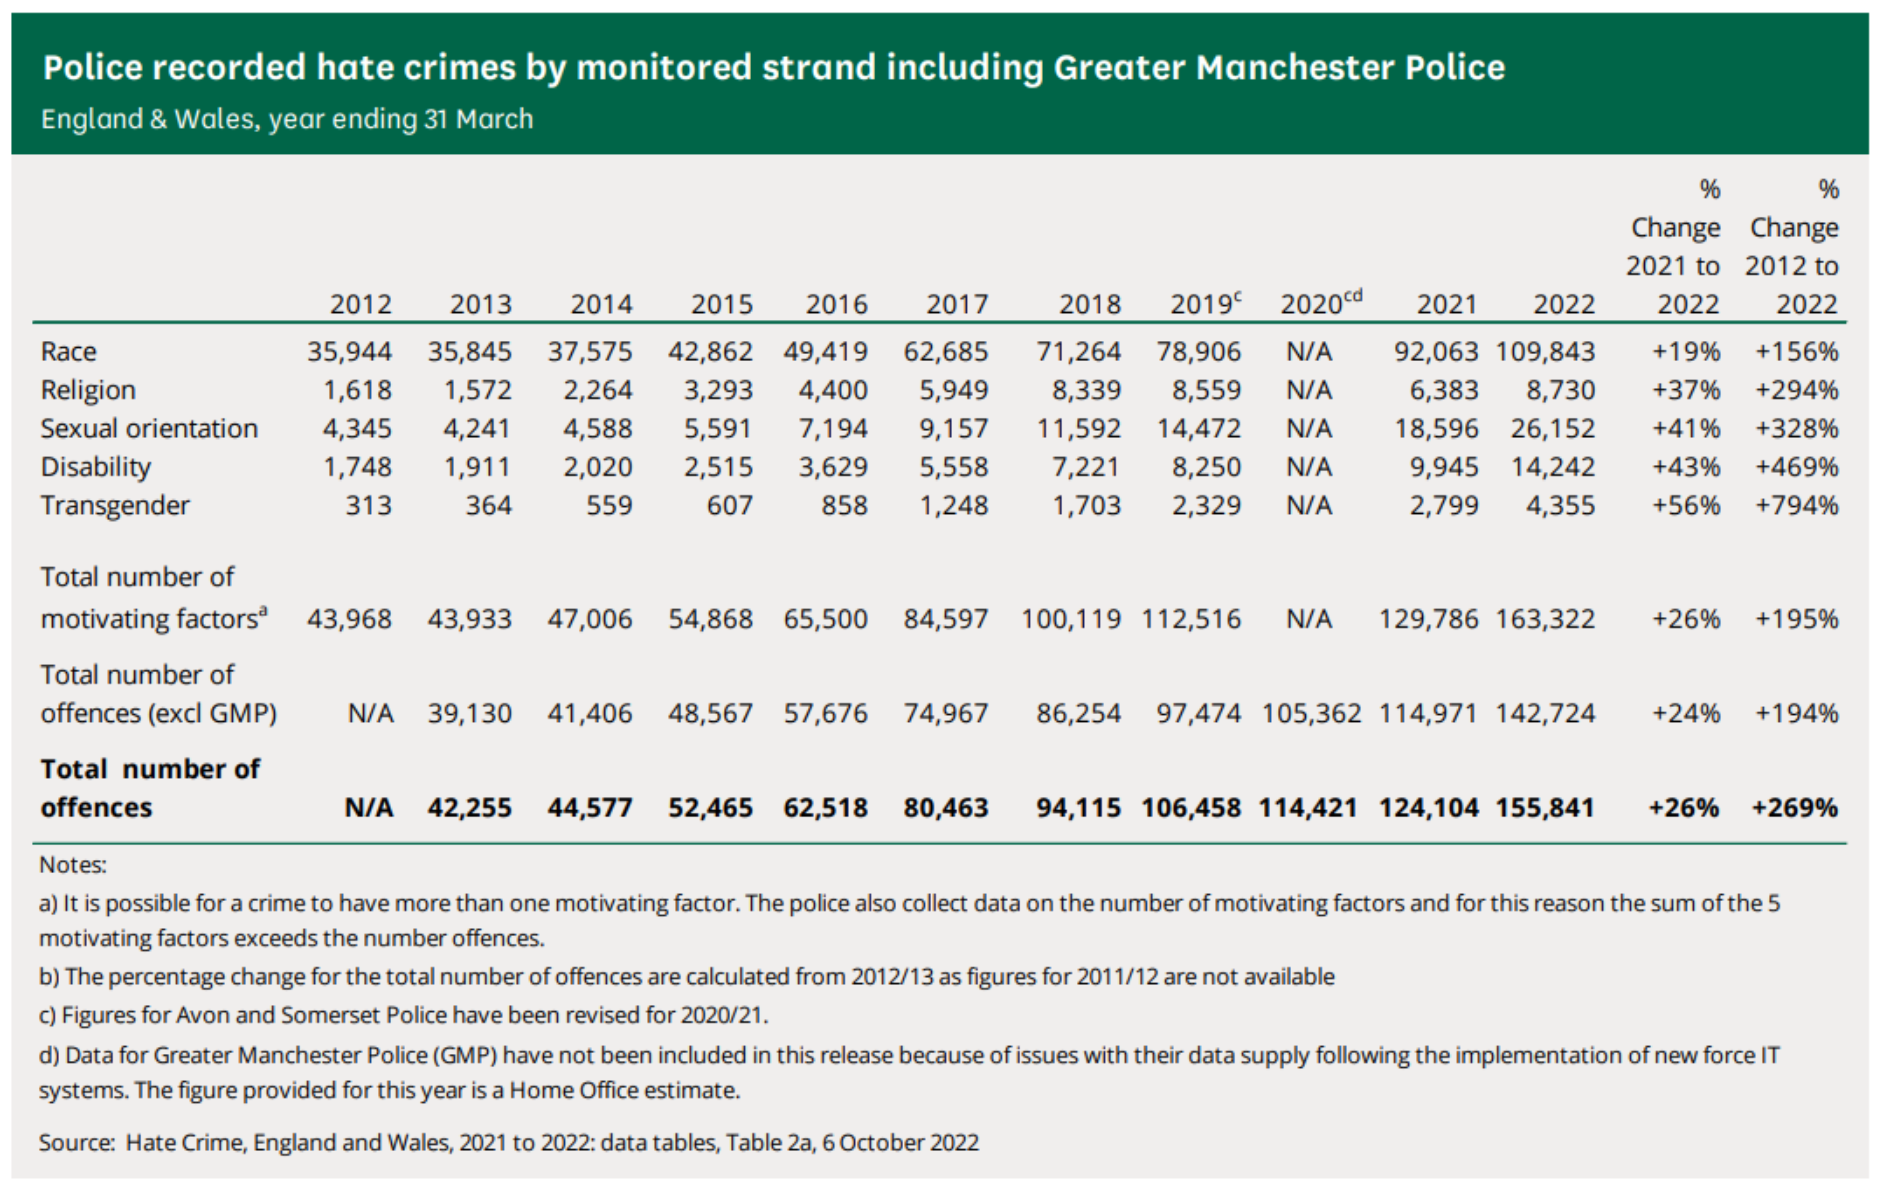
Crime statistics show an increase of 794% on the basis of being trans and an increase of 328% on the basis of sexual orientation in hate crimes in England and Wales between 2012 and 2022, as can be seen in the table below:
| 2012 | 2013 | 2014 | 2015 | 2016 | 2017 | 2018 | 2019 | 2020 | 2021 | 2022 | % Change 2021 to 2022 | % Change 2012 to 2022 | |
|---|---|---|---|---|---|---|---|---|---|---|---|---|---|
| Race | 35,944 | 35,845 | 37,575 | 42,862 | 49,419 | 62,685 | 71,264 | 78,906 | N/A | 92,063 | 109,843 | +19% | +156% |
| Religion | 1,618 | 1,572 | 2,264 | 3,293 | 4,400 | 5,949 | 8,339 | 8,559 | N/A | 6,383 | 8,730 | +37% | +294% |
| Sexual orientation | 4,345 | 4,241 | 4,588 | 5,591 | 7,194 | 9,157 | 11,592 | 14,472 | N/A | 18,596 | 26,152 | +41% | +328% |
| Disability | 1,748 | 1,911 | 2,020 | 2,515 | 3,629 | 5,558 | 7,221 | 8,250 | N/A | 9,945 | 14,242 | +43% | +469% |
| Transgender | 313 | 364 | 559 | 607 | 858 | 1,248 | 1,703 | 2,329 | N/A | 2,799 | 4,355 | +56% | +794% |
| Total number of motivating factors | 43,968 | 43,933 | 47,006 | 54,868 | 65,500 | 84,597 | 100,119 | 112,516 | N/A | 129,786 | 163,322 | +26% | +195% |
| Total number of offences (excl GMP) | N/A | 39,130 | 41,406 | 48,567 | 57,676 | 74,967 | 86,254 | 97,474 | 105,362 | 114,971 | 142,724 | +24% | +194% |
| Total number of offences | N/A | 42,255 | 44,577 | 52,465 | 62,518 | 80,463 | 94,115 | 106,458 | 114,421 | 124,104 | 155,841 | +26% | +269% |
Added: 14 May, 2023